

Exploring your data
Using the query builder
The query builder is the primary way to explore network telemetry in Spilled. Through it, you can construct a query to run against your data. Start broad, then narrow the query as you learn more. This workflow is useful during incidents because the first useful question is often not the final question.
Accessing the query builder
Open the query builder from the Spilled web app and select a dataset to query. Every query runs against a single dataset within one of your teams over the time range you specify.
Queries are executed by a query cluster in the same team as the dataset. If your team has more than one cluster, you can choose which one runs the query; otherwise Spilled uses the team's cluster by default. See Datasets and Query clusters for how these fit together.
Interacting with the query builder
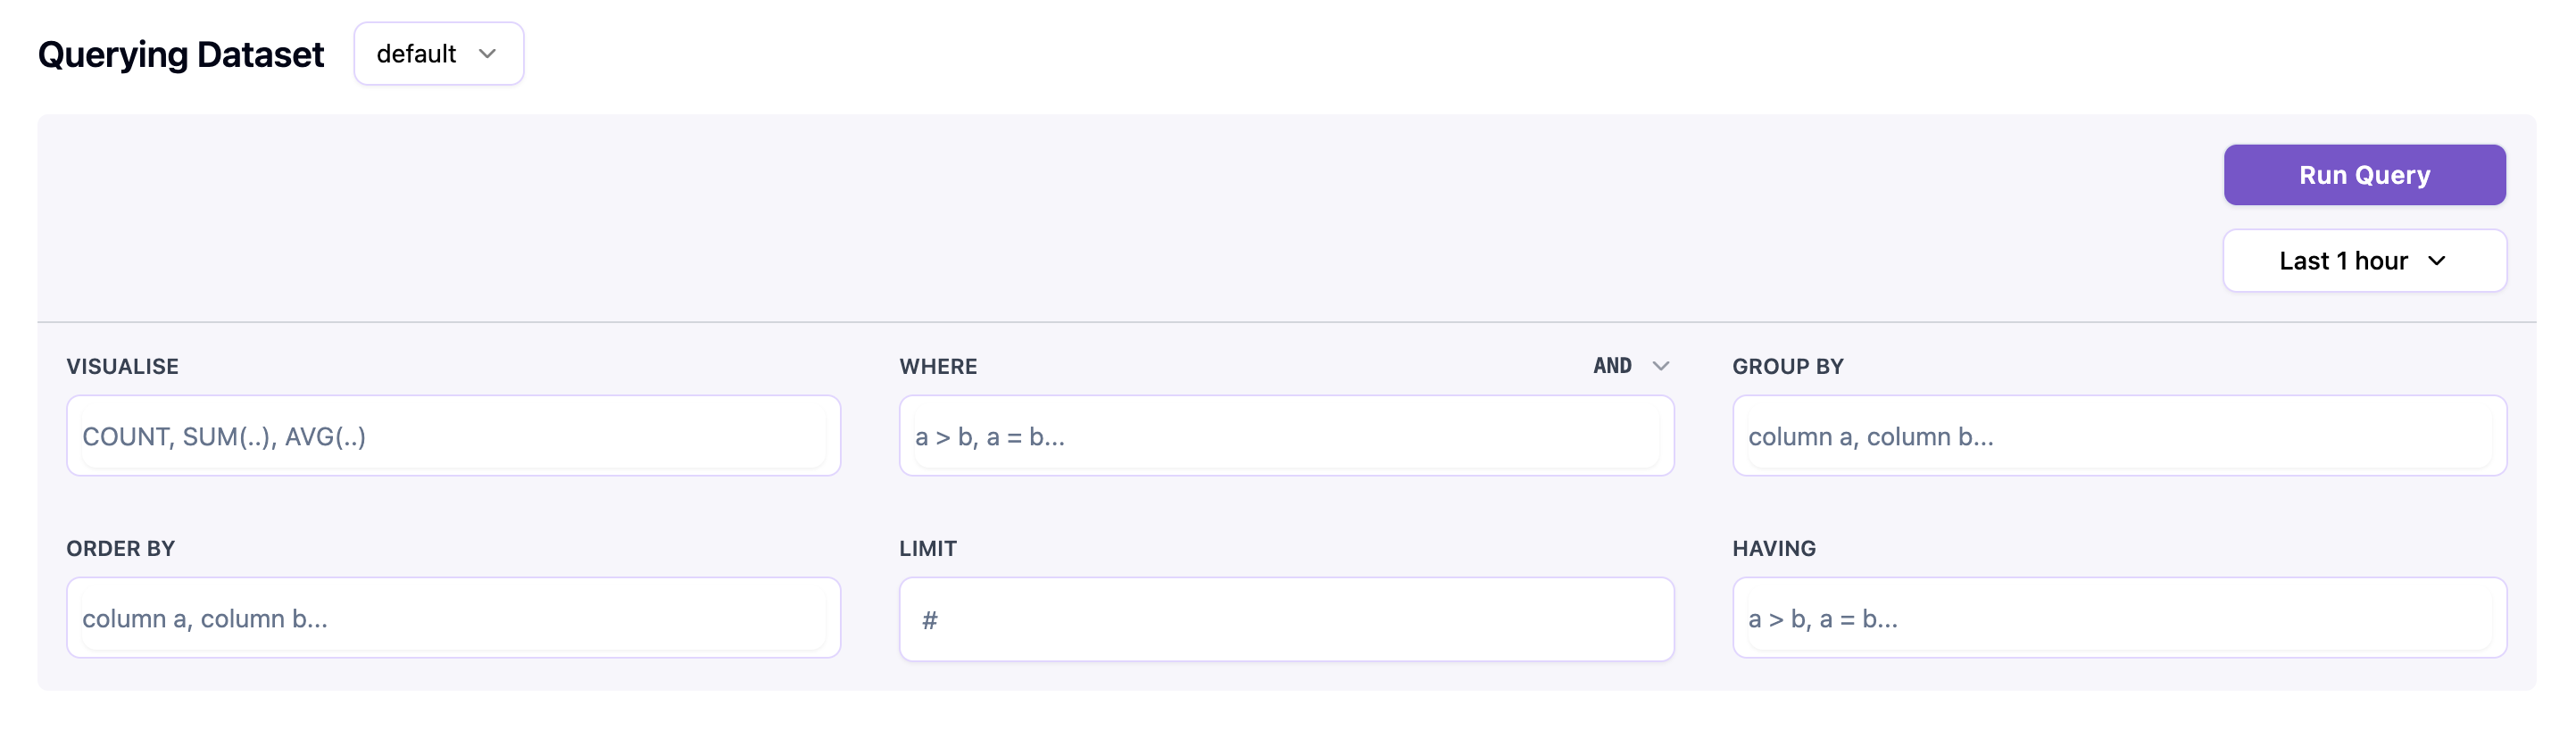
You assemble a query from a few parts: a time range, one or more measurements to show, and optional filters, grouping and sorting. Add or edit each part directly in the builder. Spilled suggests field names and values as you type.
Run the query to execute it. Results appear as a time-series chart together with a table of grouped rows. To iterate, change any part and run again: the builder is designed for moving quickly from a broad question to a precise one.
Each query is executed by a query cluster inside your own cloud. The cluster reads only the data relevant to your query from object storage and returns the results; raw flow records never leave your VPC.
Clauses
A Spilled query can include the following clauses:
| Clause | Description |
|---|---|
| SELECT | Chooses the measurement or calculation to display such as bytes, packets or flow count |
| WHERE | Filters records by field values such as source address, destination port, protocol or exporter |
| GROUP BY | Groups results by one or more fields so you can compare segments of traffic |
| ORDER BY | Sorts grouped results by a selected measurement or field |
| LIMIT | Controls how many series are returned in the result table |
| HAVING | Filters grouped results using aggregate criteria such as only showing groups above a byte or packet threshold |
Choose a time range
Pick the smallest time range that still covers the behavior you are investigating. Smaller ranges return faster and make it easier to separate signal from background traffic.
Time ranges are based on flow time when the traffic actually occurred, not when the records arrived at Spilled. Delayed exports still land in the window you expect.
Choose what to visualise
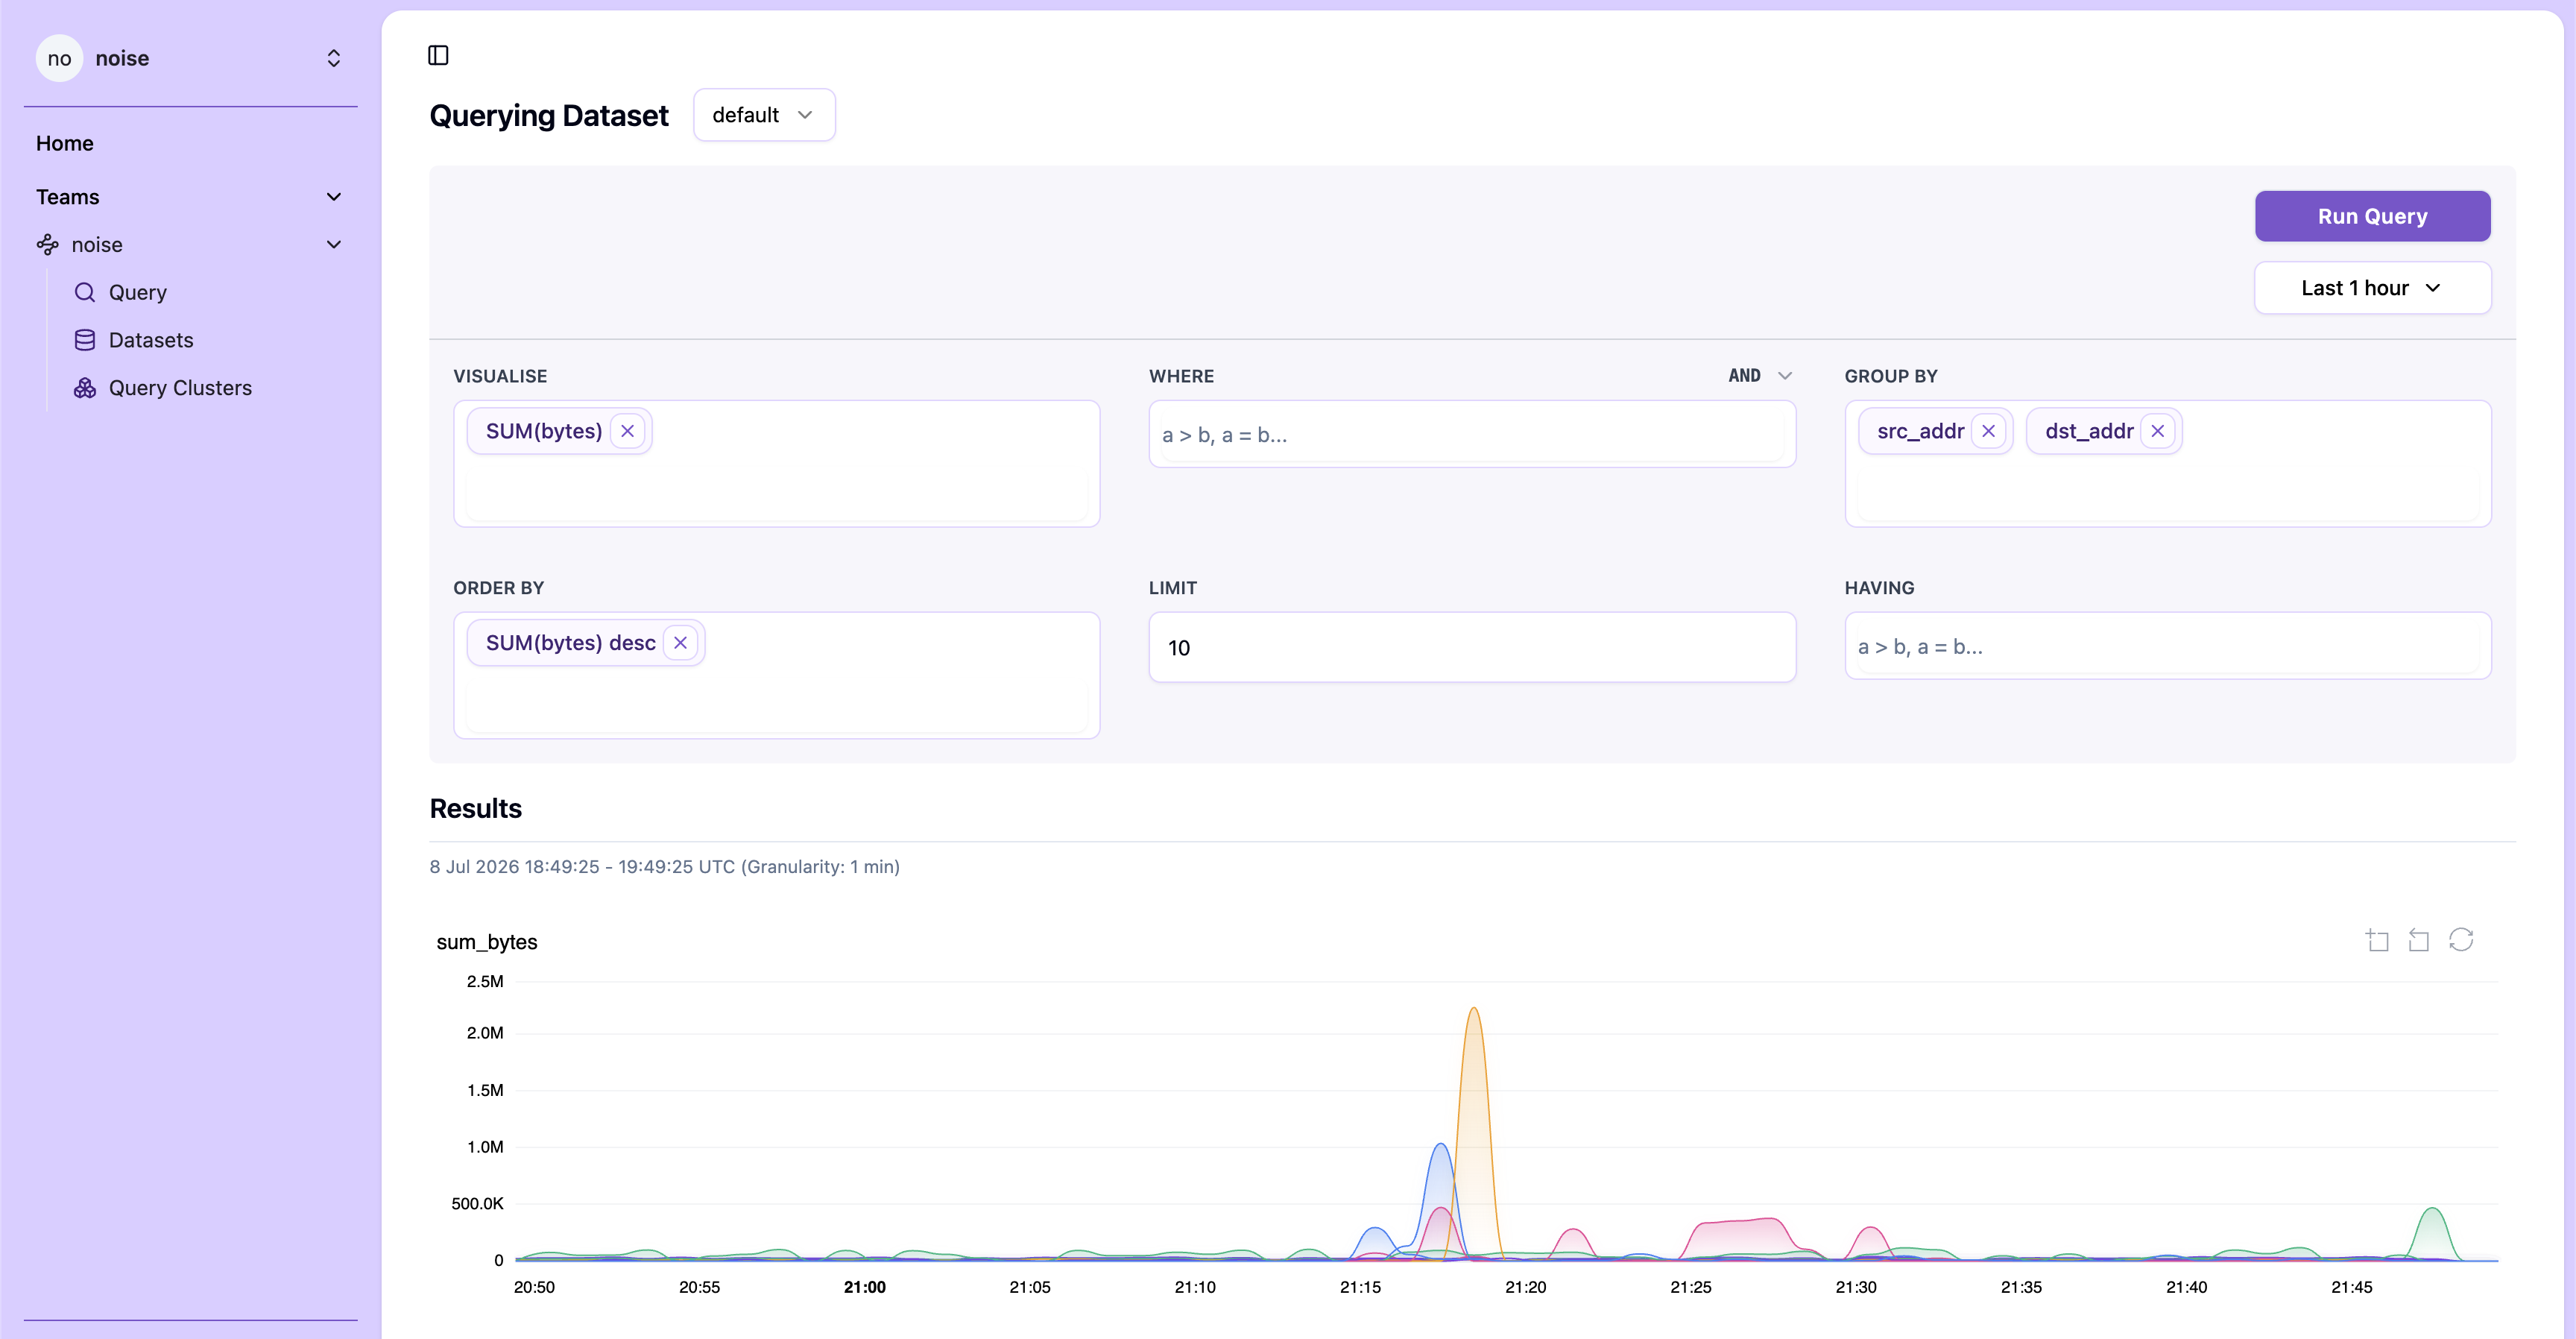
Spilled visualises your queries as time series charts over the specified time range. You can perform queries over all fields in a flow record. Common visualisations include total bytes, total packets and flow count. You can visualise more than one field in a given query. Each one becomes a separate chart.
Each flow's volume is attributed to the moment it started, so short bursts stay visible rather than being smeared across the time range.
Filter results
Filters restrict the query to relevant traffic. Common filters include source address, destination address, protocol, port, exporter or direction.
Group and sort
Grouping controls the shape of the answer and is a powerful way to compare segments of your dataset against each other. For example, grouping by destination address shows top destinations, while grouping by source and destination shows communicating pairs.
Sorting by bytes highlights large transfers, while sorting by packets can surface high-rate traffic that may not have the largest byte count. Limit the number of groups to keep top-N views readable.
Example: finding the source of a traffic spike
Suppose you notice a spike in outbound traffic and want to find what is driving it. Set the time range to the window around the spike, choose total bytes as the measurement, and group by source and destination address to see which pairs are moving the most data. Sort by bytes so the largest conversations rise to the top.
The results show the top talking pairs for that window. From there, add a filter on the busiest source to see which ports and protocols it is using, then keep refining until the pattern is explained.